Thursday, July 29, 2010

Stem and leaf plot


A Stem and leaf plot is a device for presenting quantitative data in a graphical format, similar to a histogram, to assist in visualizing the shape of a distribution.


Box plot


A graphical summary of numerical data sample through five statistics: median, lower quartile, upper quartile, and some indication of more extreme upper and lower values


histogram


A histogram is a bar chart graphical display of numerical data. The area of each bar represents frequency distribution.


Parallel coordinate graph


In a parallel coordinates graph, each variable corresponds to a axis.


Triangular plot


A triangular plot is a barycentric plot on three variables which sum to a constant. It graphically depicts the ratios of the three variables as positions in an equilateral triangle.


Windrose


A diagram indicating compass directions in terms of eight principal winds.


Climograph


A climograph is a graph which demonstrates the precipitation and temperature for an area.


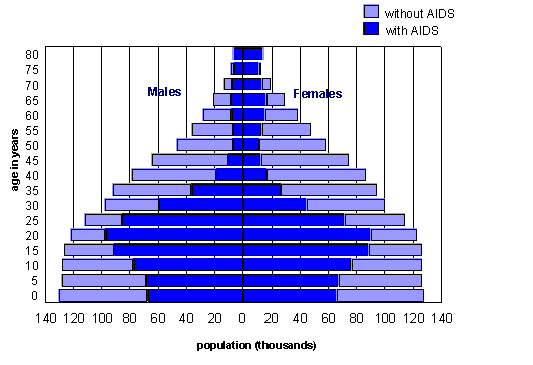
Population profile


A population profile is a chart showing the number of people as a function of their ages.


Scatterplot


A two dimensional graph representing a set of bi-variate data. For each element being graphed, there are two separate pieces of data.


Index value plot


An index member which is the ratio of the value of all items in a given period to the value of all items in the base period.


Lorenz curve


A Lorenz curve is a graph showing the proportion of the distribution assumed by the bottom y% of the values. The curve represents the cumulative distribution function of the empirical probability distribution of wealth.


Wednesday, July 28, 2010

Bilateral graph


Bilateral graphs are used to display data when there are both positive and negative values of choices.


Nominal area choropleth map


A nominal area choropleth map is a choropleth map that is used to display nominal data.


Unstandardized choropleth maps


Unstandardized choropleth maps are maps that are unordered. One category is not higher or lower than the other.


Standardized choropleth maps


A standardized choropleth map is a map that shows the distribution of a data, usually with various colors; color changes are correlated to the density per unit area of the data.


Tuesday, July 27, 2010

Univariate choropleth maps


A univariate choropleth map displays a single data set.


Bivariate choropleth maps


Bivariate mapping is an important technique in cartography, that employs two variables on a map by combining two different sets of graph symbols or colors.


Unclassed choropleth maps


http://www.esds.ac.uk/international/support/user_guides/gisoverview.asp

Unclassed choropleth maps show patterns by using different colours or different shading classed in some way.

Classed choropleth maps


http://personal.uncc.edu/lagaro/2101/2101_ProjectsS2001/JonathanKozar.html


A classed choropleth map is a map that represents data by the coloring or shading of data.

Range graded proportional circle


A range graded proportional circle is a proportional circle map that depicts the circles in relation to ranges of data.